Group 5 DEL MUNDO


Results and Discussion
The sample preparation and data collection process were in accordance with the methodology previously indicated in this study. However, during this, a few issues were encountered that led to modifications in the initial procedure.
The researchers were only able to utilize around 5 sacks of dried CG for briquetting due to time constraints. It was also suggested by DOST-FPRDI to manually crush the charcoal fines after carbonization instead of using the mechanized charcoal crusher, as it was easier and would prevent the machine from getting congested. With this, the carbonized plant samples were powderized by hand, yielding 1200 g in total for CG and 230 g for WH. Initially, the study used three CG biomass-CS binder ratios adapted from a study on WH briquettes by Carnaje et al. (2018). However, with the guidance of DOST-FPRDI, it was revised into varying CG-binder ratios: CG1(1:2.1), CG2(1:1.75), and CG3(1:1.87), and a control group WH(1:2.1). Altogether, the researchers were able to procure around 158 CG and 24 WH cylinder briquettes with its weight ranging from about 7–13.5 g, enough to test its characterization.
Data gathering for proximate analysis, calorific value, ignition test, and burning rate proceeded as planned in their respective institutions. However, the researchers found no facility that provided gas emission analysis for briquettes and had to discontinue it. Unfortunately, no data were collected regarding this test. For data analysis, further evaluation using ANOVA was conducted between groups for more focused comparisons in addition to MANOVA.
Proximate Analysis
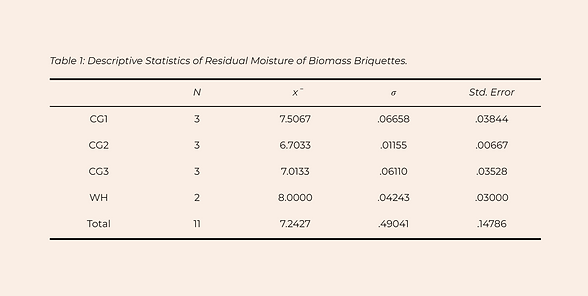
The descriptive analysis for residual moisture of biomass briquettes is shown above in Table 1. Based on the data listed in the mean column, WH has the highest moisture content of 8.00 wt%, while CG2 has the lowest. Following WH is CG1 and CG3 with a moisture content of 7.51 wt% and 7.01 wt% respectively. As for the variance, CG2 also has the lowest value of 0.01, while CG1 has the highest with 0.07. On the other hand, although WH has the highest mean, it has a low variance of 0.04 next to CG3 with 0.06.
Biomass materials grown in humid climates are more susceptible to moisture absorption from its surrounding environment than those from dry climates, causing them to have higher amounts of moisture, therefore lower energy content
when converted to solid fuel (Ungureanu & Nicoleta, 2018). With this, the researchers have already predicted that water hyacinth contains higher moisture than cogon grass considering their respective habitat. This aligns with the findings of Rezania et al. (2016), which indicates that water hyacinth briquettes have a moisture content of 9.3 wt%, while Promdee & Vitidsant et al. (2013) states that cogon grass biomass has a moisture content of 2.23 wt%. Based on the gathered data, the moisture content of the cogon grass briquettes is higher than its biomass form. This increase in moisture content of cogon grass briquettes could be associated with the addition of binder in the biomass material, as proven by the study of Ige et al. (2020). The researchers investigated the effect of binder concentrations to the physical characteristics of rice stalk briquettes and they found that the highest moisture content (22.5 wt%) was obtained from the briquettes with 20% binder concentration, while the lowest (15.0 wt%) was from the briquettes with no binder. Similarly, the results of this study shows that WH and CG1 with the highest amount of binder (2.1 %) also have the highest moisture content, followed by CG3 (1.87%), then the lowest is CG2 (1.71%). Having this said, the researchers infer that introduction of binder concentrations in producing biomass briquettes increases the moisture content.
Presented in Table 2 are the descriptive statistics obtained from the results of the volatile matter composition of the biomass briquettes. The mean column reveals that the values for CG briquettes range from 26.52%-28.14%, while WH briquettes had an average of 30.74%. The control group had the overall highest volatile matter, but CG3 was the highest within the experimental unit with 28.14% and the largest variance of 0.23. Following this is CG1, having 28.06% and a lower variance of 0.10. Whereas, the lowest volatile matter and smallest variance were found in CG2, with values of 26.52% and 0.06, respectively. Volatile matter determines the remaining non-water components that were not released during carbonization and can affect the product's combustibility (Dass et al., 2019). Akintaro et al. (2017) stated that good quality briquettes measure 10%-25% in this component; however, the values obtained in the study were higher than this range.

A higher amount indicates easier combustion, which is reflected in the quick ignition of the CG briquettes (Dass et al., 2019). On the other hand, a lower value may result in incomplete combustion but is desirable for a higher calorific value (Katimbo et al., 2014).
Although the amount of volatile matter in the CG briquettes did not fall under the desirable range, comparing it to previous studies reveals that it became lower than when it did not undergo the briquetting process (Hidayat et al., 2018; Walter & Rao., 2015). The study varying from 26.52%-28.14% expressed that briquette production, including carbonization and densification, has a favorable effect on the volatile matter content.
Generally, the volatile matter content of biomass varies from 70%-80% (Katimbo et al., 2014). Thus, the results of the study had a lower value compared to other research, as seen in water hyacinth, dried mango leaves, and pine needles (Carnaje et al., 2018; Rezania et al., 2016; Ycaza & Barre, 2018; Ajimotokan et al., 2019). Contrary to this, briquettes made of agro-waste, ulin wood, gelam wood, starch, sawdust, and corncob measured lower (Dass et al., 2019; Amrullah et al., 2020; Katimbo et al., 2014; Inegbedion, 2022; Akintaro et al., 2017). These inequalities could be linked to the difference in the briquette preparation, the chemical composition of the biomass, or the binder source and amount (Zhao et al., 2016). Based on previous studies, a higher concentration of binder in the briquette mixture generates a high volatile matter content (Carnaje et al., 2018). Likewise, CG2 had the smallest binder ratio and the lowest mean as well.
In addition, a lower value for WH was obtained in this study compared to the WH briquettes of Carnaje et al. (2018) and Rezania et al. (2016), which can be attributed to the different process of briquetting and choice of binder. This also suggests that the process used in this study is suitable and the use of a starch binder is favorable, in terms of volatile matter. Agreeing with this are the findings of the study by Akintaro et al. (2017), where corn cob briquettes with cassava starch binder had the most preferable values, together with cornstarch and gelatin starch binders.
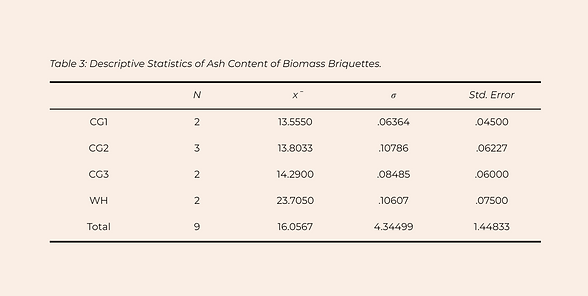
Shown above is Table 3, which represents the descriptive statistics for the ash content of the biomass briquettes investigated in this study. The mean column shows that in the range of 13.56 wt% to 23.70 wt% ash content, WH has the highest value, while CG1 has the lowest. Next to WH was CG2 with an ash content of 13.18 wt%, followed by CG3 with 14.29 wt%. As for the variance, although C1 has the highest ash content, it has the lowest variance of 0.063, while CG2 has the highest with a value of 0.107. On the other hand, while WH has the highest ash content, its variance of 0.106 only comes next to CG2. Lastly, CG3 precedes CG1 with a low variance of 0.085.
As stated in the study of Liu et al., 2018, ash content pertains to the non-combustible parts of a biomass material, which negatively affects its quality as efficient briquettes are regarded with low content of ash. This aligns with the
results of the ash content and calorific value of the WH and CG3 briquette samples results of the ash content and calorific value of the WH and CG3 briquette samples that were analyzed in this research. With its high ash content, WH had the lowest calorific value of 3383.75 cal/g, preceded by CG3 with an energy content of 5316.75 cal/g. This suggests that the higher the amount of ash, the lower the calorific value of biomass briquettes. However, this findings does not support the collected data on CG1 and CG2, wherein despite having a higher ash content than CG1, CG2 had a higher calorific value. As such, other briquette characteristics may have influenced the properties of the samples, such as bulk density, which the researchers were not able to take into account in this experiment. According to Saeed et al. (2015), bulk density also affects the combustion efficiency and durability of briquettes.
On the other hand, the results of this study contradicts the findings of Carnaje et al. (2018), where ash content was shown to decrease as the biomass briquettes contain more binder. WH, with the highest binder concentration, also had the highest amount of ash. Similarly, the direct relationship of the said variables were also evident on the data of CG2 and CG3.
Calorific Value
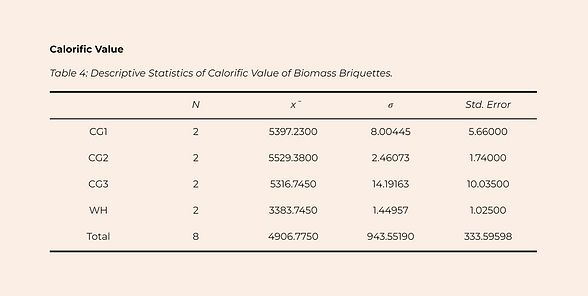
The table above illustrates the descriptive statistics for the calorific value of biomass briquettes. The data listed in the mean column shows that the energy content of briquettes range from 3383.75 cal/g to 5529.38 cal/g, with CG2 having the highest calorific value and WH having the lowest. As for CG1 and CG3, they have a calorific value of 5397.23 cal/g and 5316.75 cal/g respectively. In relation, along with having the lowest mean, WH also has the lowest variance of 1.45, while CG3 has the highest variance of 14.19. C1 has a variance of 8.00, while CG2, contrary to its high mean, has a low variance 2.46.
According to previous literature, calorific value is the major parameter that dictates the quality of briquettes (Anatasya et al., 2019; Gendek et al., 2018). The higher the calorific value of a briquette, the more energy it can provide, making it more efficient. As stated by Carnaje et al., 2018, altering the composition of briquettes, particularly their biomass to binder ratio, affects the calorific value as well as other briquette characteristics, thereby influencing their overall quality. Based on the results of this study, CG2 with 1:1.75 biomass to binder ratio produces the highest amount of energy compared to CG1 with 1:2.1 biomass to binder ratio. This finding supports the statement of Nurhayati et al. (2016) that the increase in calorific value of rice husks with corn cob briquettes could be due to the increase in starch binder concentrations. In line with this, the study of Akintaro et al. (2017) on corn cob briquettes also mentioned the same findings. However, increasing the binder concentration further was shown to significantly decrease the calorific value of CG3 with 1:1.87 biomass to binder ratio. Anatasya et al., 2019 had a similar trend of data, wherein increasing the starch concentration of cow dung briquettes from 15% to 20% generated higher calorific value from 3314.30 cal/g to 3550.60 cal/g. But adding more starch binder to 25% produced a lower calorific value of 3418.60 cal/g. This suggests that while increasing the amount of binder improves the energy content of briquettes, determining its optimal ratio with the amount of charcoal is significant to assure that the potential of the biomass material as energy source would not be compromised.
Ignition Time
The table above provides the useful descriptive statistics for the ignition time of biomass briquettes with 5 ml and 10 ml kerosene. Briquettes with 0 ml kerosene did not ignite, therefore producing no results from the test. From the mean column, it can be seen that the briquettes with 5ml kerosene burned at a range of 219.50 seconds to 368.02 seconds, with CG3 having the highest mean and WH having the lowest. Although WH has the lowest mean, it has a low variance of 11.56 while CG3 has 59.69. CG1 has the lowest variance of 11.52 while CG2 has the highest variance of 70.95. On the other hand, briquettes with 10 ml kerosene burned at a range of 688.91 seconds to 820.09 seconds, with CG2 having the highest mean and CG3 having the lowest mean. CG2 also has the lowest variance of 72.20 while WH has the highest variance of 334.75. CG1 and CG3 have variances of 118.63 and 207.42 respectively.
Based on previous studies, briquettes with increased binder composition tend to have longer ignition time (Carnaje et al., 2018; Senchi & Kofa, 2020). The fact that briquettes with low binder content burned off more quickly than those with high binder content meant that they required more fuel to burn for a longer period of time. Thus, it was expected that CG1 would have the longest ignition time. This study however showed that CG3 has the longest ignition time with 5 ml kerosene while CG2 has the longest ignition time with 10 ml.
Additionally, the briquettes in the study burned significantly longer than the previous literature mentioned. From the raw data, the CG briquettes burned at a range of 190.26 seconds to 919.88 seconds. On the other hand, water hyacinth briquettes made with molasses by Carnaje et al. (2018) burned for about 216 seconds. Davies and Abolude (2013) made water hyacinth briquettes with phytoplankton scum as binder and reported an ignition time that ranged from 83 to 138 seconds. The differences may be attributed to other factors such as quality of briquette or its morphological characteristics. As discussed in a study by Promdee et al. (2015), charcoal made with CG that has high porosity and high micropore rate may be able to use more active material during combustion. Because of the spaces and holes in the charcoal, more air enters the sample and aids in the combustion of the material, effectively prolonging the ignition time.

Burning Rate
The descriptive statistics for the burning rate of the biomass briquettes with 5 ml and 10 ml of kerosene is shown in Table 6. There were no results procured from briquettes with 0 ml kerosene as it did not ignite and burned. As indicated in the mean column, CG1 has the highest burning rate with 5 ml of kerosene with 0.027 g/s while CG3 has the lowest with 0.009 g/s. CG1 also has the lowest variance with 0.004 while CG2 has the highest variance with 0.012. Additionally, the group burned with 10 ml of kerosene that had the highest mean is the WH briquettes (0.0096) followed by CG1 (0.0068), while CG2 had the lowest mean (0.0057). However, CG2 had the lowest variance out of all groups with 0.00065 and WH had the highest with 0.00373.
Burning rate is the amount of briquette (in grams) burned in a certain amount of time. From the results, it is seen that briquettes with longer ignition time had lower burning rate. In briquettes burned with 5 ml kerosene, CG3 had the longest ignition time and the lowest burning rate, same with CG2 in briquettes burned with 10 ml of kerosene. According to studies, the burning rate of the briquettes decreases with increased binder ratio (Carnaje et al., 2018; Davies and Abolude, 2013; Senchi & Kofa, 2020). With this fact, it was expected by the researchers that CG1 will have the lowest burning rate as it has the most binder ratio. However, results from this study shows that the means of the briquettes with lower binder ratio (CG2 and CG3) had lower burning rate than CG1. The difference may be contributed by factors such as density and porosity that were not taken note of by the researchers (Davies and Abolude 2013). It should also be noted that ash content may also affect the burning rate as it has low thermal conductivity, leading to a slower flame propagation in the binder (Carnaje et al., 2018).


Relationship Between Briquette Characteristics
Table 7 presents the data of the multivariate test (MANOVA) for the characterization of briquettes. The briquettes show a non-significant difference between the proximate analysis and the calorific value on the ignition and burning rate. The p-value is greater than the significance level, however there is a statistically significant difference between the proximate analysis and the calorific value. The researchers conducted a test on between-subject effects to analyze the correlation of the dependent variables which resulted in a significance in the proximate analysis and the calorific value with a significant difference of p < 0.05 of < .001 .

The amount of binder affects the ignition time and burning rate of the charcoal briquettes, however, the ignition time and burning rate does not have a significant effect on the proximate analysis and calorific value of the briquette, as the calorific value is primarily determined by the heat or energy released during combustion. Increased binder lengthens the ignition time and decreases the burning rate (Adam et al., 2021; Carnaje et al., 2018). However, the data retrieved by the researchers showed a different outcome with a decreased binder yielding a longer ignition time and higher burning rate that could have been affected by factors like the physical and morphological structure of the briquettes altering the results of the briquettes.
The proximate analysis is composed of three characteristics: ash content, volatile matter, and moisture content, which affects the calorific value. It shows an indirectly
proportional relationship; with a lower ash and moisture content yielding a higher calorific value and the volatile matter mainly affecting its combustibility (Di et al., 2021). Based on the results, the CG2 with the lowest amount of residual moisture yielded the highest calorific value among the other 2 ratios. However, CG1 with the highest residual moisture content produced a higher calorific value than CG3 which could have been affected by the ash content. CG3 with the highest amount of ash content resulted in the lowest calorific value. According to Carnaje et al. (2018) several studies have proven the correlation of ash and moisture in briquettes contributing to the decrease of calorific value. The briquette with the greatest moisture content had the lowest heating value due to the increase in moisture caused by the binder, since not all of the energy stored in the charcoal can efficiently be transferred (Carnaje et al., 2018). This implies that factors like the ash and moisture have a significance with the energy output which was reflected in the data analysis of the researcher. In addition to that, the data set of volatile matter retrieved by the researchers from DOE, the briquette with a lower volatile matter resulted in a higher calorific value.

Analysis of Proximate Analysis
Analysis of Residual Moisture
As illustrated above, Table 8 describes the One-Way ANOVA of the residual moisture between the varying samples of WH and CG briquettes. The Sig., which represents the p-value, is less than the significance level ɑ = 0.05. This means that there is a statistically significant difference between the residual moisture in different groups, thereby rejecting the null hypothesis. Along with this, the researchers conducted a Tukey’s HSD Post Hoc Test to determine which among the groups resulted in a significant difference. Based on the results of the analysis, WH resulted in the most significant difference on the CG groups in each of its ratios.
As indicated by the gathered data, WH contains a higher amount of moisture in comparison to the three ratios of CG briquettes: CG1(1:2.1), CG2(1:1.75), CG3(1:1.87). Studies suggest that this could be correlated with the amount of binder concentration used in producing the briquettes, stating that as the amount of binder increases, the moisture of the resulting briquettes also increases (Ige et al., 2020, Aransiola et al., 2019). Aside from this, moisture content in biomass briquettes was also found to have an inversely proportional relationship with its calorific value (Deshannavar et al., 2018). In the study, the researchers analyzed briquettes made of rice husk and starch binder. The findings express that rice husk briquette with the highest moisture content (8.40 wt%) among the three setups generated the least energy (18.57 MJ/kg). Following this was the briquette samples with 6.10 wt% moisture content that generated a calorific value of 19.27 MJ/kg, and lastly is the briquette ratio with the least moisture content (0.30 wt%), resulting to the highest amount of energy produced (20.1 MJ/kg). However, the data on the briquettes investigated in this study do not align with the stated conclusion, except for CG2, which has the least amount of moisture and highest calorific value. As for CG1, CG3, and WH, they do not exhibit the same relationship in terms of the mentioned variables, implying that other briquette properties, such as porosity, may have contributed to its contrasting results.
Analysis of Volatile Matter
Table 9 presents the One-Way ANOVA between the volatile combustible matter content of CG and WH briquettes. The computed p-value is denoted by Sig., with a value of <0.001, and is less than the significance level of ɑ = 0.05. This leads to rejecting the null hypothesis, thus indicating that there is a significant difference between the volatile matter of the groups. From this, further analysis using Tukey’s HSD Post Hoc Test was conducted to reveal which particular groups are affected by this. Each of the different CG briquettes and WH briquettes was found to have a significant difference, except between CG1 and CG3.
It can be observed that the measure of volatile matter increases as the binder ratio increases. This matches the findings of Carnaje et al. (2018), in which rising the amount of molasses binder in WH briquettes increases the said composition. This proportional relationship can also be found between the volatile matter of charcoal briquettes with and without a binder (Kumar et al., 2020). A possible factor that may have influenced this is the carbonization process and the binder that is added after it (Ajimotokan et al. 2023). In order to eliminate the unwanted materials in the briquette composition, it undergoes the heating process and contributes to devolatilization. Thus, the binder mixture added after this could affect the volatile matter content. Overall, this suggests that the amount of binder can significantly affect the amount of volatile matter in briquettes.
Analysis of Ash Content
Table 10 presents the One-Way ANOVA of the ash content between the different ratios of CG briquettes and WH briquettes. The p-value is indicated by Sig. and has a value less than the significance level ɑ = 0.05 (p < 0.05). With this, the researchers reject the null hypothesis, which expresses that there is a significant difference between the amount of ash in the different groups. Adding to this, Tukey’s HSD Post Hoc Test was conducted to identify which specific groups are significant to one another. Results from the analysis show that it is present between each of the ratios of CG and WH briquettes, except between CG1 and CG2.
The data collected tells that CG briquettes have significantly less ash content than those of WH, showing that different sources of biomass and/or binder have an effect on the resulting combustion properties. As Feng et al. (2021) discussed, there are two main factors that affect the physicochemical properties, including ash content, of biomass: the raw materials used and the carbonization process. In this study, both biomasses used are regarded as lignocellulosic biomass, primarily consisting of lignin, cellulose, and hemicellulose, but the composition of each component varies between them. They have similarly low lignin content, but WH (4.1%) is lower than CG (5.67%) (Tanpichai et al., 2019, Zarib et al., 2020). Likewise, the amount of cellulose in CG (∼37.1%) can be higher than WH (∼19.2–57.0%). These components are essential in materials used for biofuels because they promote the production of biochar through pyrolysis or carbonization and affect the resulting proximate analysis and calorific value (Lu & Gu, 2022). The results of this study are possibly caused by the higher measure of cellulose in CG, which is also seen in the study by Oluwasina (2022), where biomass with more cellulose displayed lower ash content. Agreeing with this is the study by Feng et al. (2021), which compared the properties of multiple invasive species, and revealed that CG biochar produces less ash (20.70%) than WH biochar (43.04%). Moreover, Dorez et al. (2021) also found that biomass with lower lignin content interacted with cellulose in a way that generated more char yield for flax and hemp fibers. Although CG may have higher lignin content than WH, Lu & Gu (2022) and Zhao et al. (2016) stated that the cellulose content contributes to the yield of biofuels more than lignin and hemicellulose. The results also parallel a study by Suman et al. (2021) where the sample with the highest cellulose and lignin still had the lowest ash content. In addition, the type of binder is another possible factor in the lower ash content of the CG briquettes, as reflected in the study of Adam et al. (2021), which found lower ash in tapioca or cassava starch briquettes compared to corn starch briquettes.
A significant difference was also found between the varying ratios of CG briquettes; the ash content decreases as the binder concentration increases. This agrees with the results of Carnaje et al. (2018) that increasing the ratio of molasses binder decreases the amount of ash produced. Some of the inorganic and non-flammable particles that cause more of this property are drawn from the biomass source (Sukarni et al. 2019). Increasing the ratio of binder means decreasing the amount of biomass and reducing the said particles included in the briquettes. Katimbo et al. (2014) have linked this as the cause of varying ash content within different ratios. As the ash content is defined as the amount of non-combustible residue, it is ideal in low percentages. Thus, the results of this test show that the briquettes made with CG and CS and have a higher binder concentration are more efficient in terms of ash content.

Analysis of Calorific Value
Table 11, as shown above, presents the comparison between the means of the calorific value of the CG and WH briquettes. The Sig., which indicates the statistical significance of the analysis has a value less than the significance level ɑ = 0.05, which pimples that there is a statistically significant difference between the calorific value in different groups. Therefore, the researchers rejected the null hypothesis. Additionally, Tukey’s HSD Post Hoc Test was performed to identify which specific group caused a significant difference. According to the findings of the analysis, WH and CG briquettes in each of their ratios are significant to one another, except for CG1 and CG3.
According to the study of Deshannavar et al. (2019), properties of biomass briquettes, including the ash content, volatile matter, and moisture content negatively influences the calorific value, meaning that the higher the amount of those variables, the lower energy content is produced. The results of this study evidently agree with the stated findings in terms of the volatile matter of biomass briquettes. CG2 with the lowest amount of volatile matter (26.52 wt%) produced the highest calorific value (5529.38 cal/g), while WH with the highest volatile matter (30.74 wt%) generated the lowest energy (3383.75 cal/g). Similarly, the study by Gillespie et al. (2013) states that the volatile matter content of biomass briquettes causes fixed carbon contents to lessen, which can be associated with the calorific value since it has a positive effect on the energy potential of biomass. However, in terms of the amount of moisture and ash content, this research found conflicting results, wherein only some data on the briquettes aligns with the results of past literature as previously discussed. With this, the researchers infer that other briquette characteristics, including physical and morphological properties that are not explored in this study, may be attributed to the contradicting findings.
Analysis of Ignition Time

Table 12 shows the comparison between the means of the biomass briquettes’ ignition time with 5ml kerosene. The statistical significance of the analysis is indicated by Sig., with a value less than the significance level of 0.05 (p < 0.05). This suggests that there is a statistically significant difference between the groups. Tukey’s HSD Post Hoc Test was then conducted in order to find the group that caused a significant difference. From that, it was found that CG3 caused the most significant difference on CG1, CG2, and WH groups. With this, the researchers have statistically significant evidence to reject the null hypothesis.
Ignition time is defined as the period of time the briquette burns from the first sign of fire until it runs out. Factors such as the briquettes’ mass and quality of production can significantly affect its ignition time. Briquettes with less mass tend to burn off quickly, therefore reducing its ignition time; while more mass can result in longer ignition time (Davies and Abolude, 2013). Because CG3 significantly had longer ignition times and lower burning rate, it can be concluded that its mass and quality may have affected its results.
Beyond the scope of the study, it is also known that the briquettes’ micropore rates and porosity have a significant effect on the airflow of the sample during combustion (Promdee et al., 2015). When there is a high porosity and micropore rate in the briquette, there will be more space for the air to flow during combustion, therefore affecting how long the sample will burn.

Table 13 shows the comparison between the means of the biomass briquettes’ ignition time with 10ml kerosene. As the p-value indicated by Sig. is greater than the significance level 0.05 (p > 0.05), it can be concluded that there is no statistically significant difference between the groups, leading to a failure to reject the null hypothesis.
As previously mentioned, the duration a briquette burns from the time a fire first develops until it is put out is known as its ignition time. Variables like the mass and manufacturing quality of the briquettes can have a significant impact on how long they burn. In contrast, briquettes with more mass may have longer ignition time because of their tendency to burn off more slowly (Davies and Abolude, 2013). According to the descriptive data, CG2 had the slowest ignition and burning rates, but this did not significantly differ the groups from one another. Given that CG2 had noticeably longer ignition times and a lower burning rate, it can be assumed that its mass and quality may have had an effect on its results.
Moreover, one of the factors that assist in the combustion of the briquettes is the amount of air that flows through the sample. Although it is beyond the scope of the study, the amount of room for air to flow during combustion will depend on the briquette's porosity and micropore rate (Promdee et al., 2015). Thus, higher morphological characteristics result in more air traveling through the sample and producing longer ignition time.
Analysis of Burning Rate

The table above shows the comparison between the means of the biomass briquettes’ burning rate with 5 ml kerosene. The statistical significance of the analysis is indicated by Sig., with a value more than the significance level of 0.05 (p > 0.05). Thus, suggesting that there is no statistically significant difference between the groups. This leads to a failure to reject the null hypothesis.
The lack of statistical significant difference between the groups may be attributed to other factors such as its physical (density) and morphological (porosity) characteristics that are beyond the scope of the study. It is supported by Carnaje et al. (2018) and Davies and Abolude (2013) that by decreasing the rate at which oxidant diffuses and infiltrates during combustion, reductions in porosity and, as a result, increases in density might alter briquettes' capacity to burn more quickly. All groups in the study possibly have close variations in terms of its physical and morphological properties, resulting in the lack of statistical significant difference between them. This suggests that the amount of binder in the briquette does not significantly affect its burning rate with 5ml kerosene.

Table 15 shows the comparison between the means of the biomass briquettes’ burning rate with 10 ml kerosene. The p-value indicated by Sig., was found to be more than the significance level 0.05 (p > 0.05). This reveals that there is no significant difference between the groups, failing to reject the null hypothesis.
As mentioned above, the lack of significant difference between the groups may be attributed to the same characteristics mentioned (density and porosity). The large porosity between inter- and intra-articles, which makes it easier for oxygen to percolate through and allow combustion briquettes to exit due to low bonding force, may be responsible for the burning rate (Davies and Abolude, 2013). There may not have been a statistically significant difference between the groups in the study due to their near similarities in terms of physical and morphological characteristics. This indicates that the briquette's ability to burn with 10 ml of kerosene is not significantly affected by the amount of binder present.